Posted: April 10, 2019
The Behaviour Change by Design (BCbD) programme organised a series of activities for Cambridge Science Festival called ‘Sugar Shock’. Our aim was to help people think about the ways in which their environments can shape their health by influencing how much sugar they eat.
We are interested in three broad types of changes to the environment that could improve health:
1. Availability – The availability of healthier vs less healthy foods in the supermarket, the availability of alcoholic vs non-alcoholic drinks in bars and the availability of shared vs separate places for tobacco and e-cigarette use.
2. Size – The size of tableware (e.g. plates, bowls and glasses), the size of portions of alcoholic drinks and the size of cigarette packs
3. Labelling – Energy content and health warning labels on sugary drinks, high calorie snacks and alcoholic drinks
We set up an activity about each of these for the science festival. Read on to find out more.
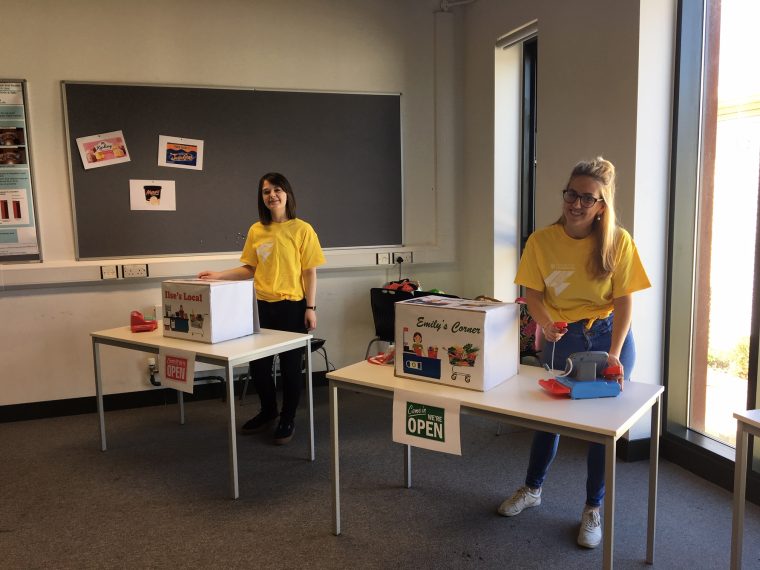
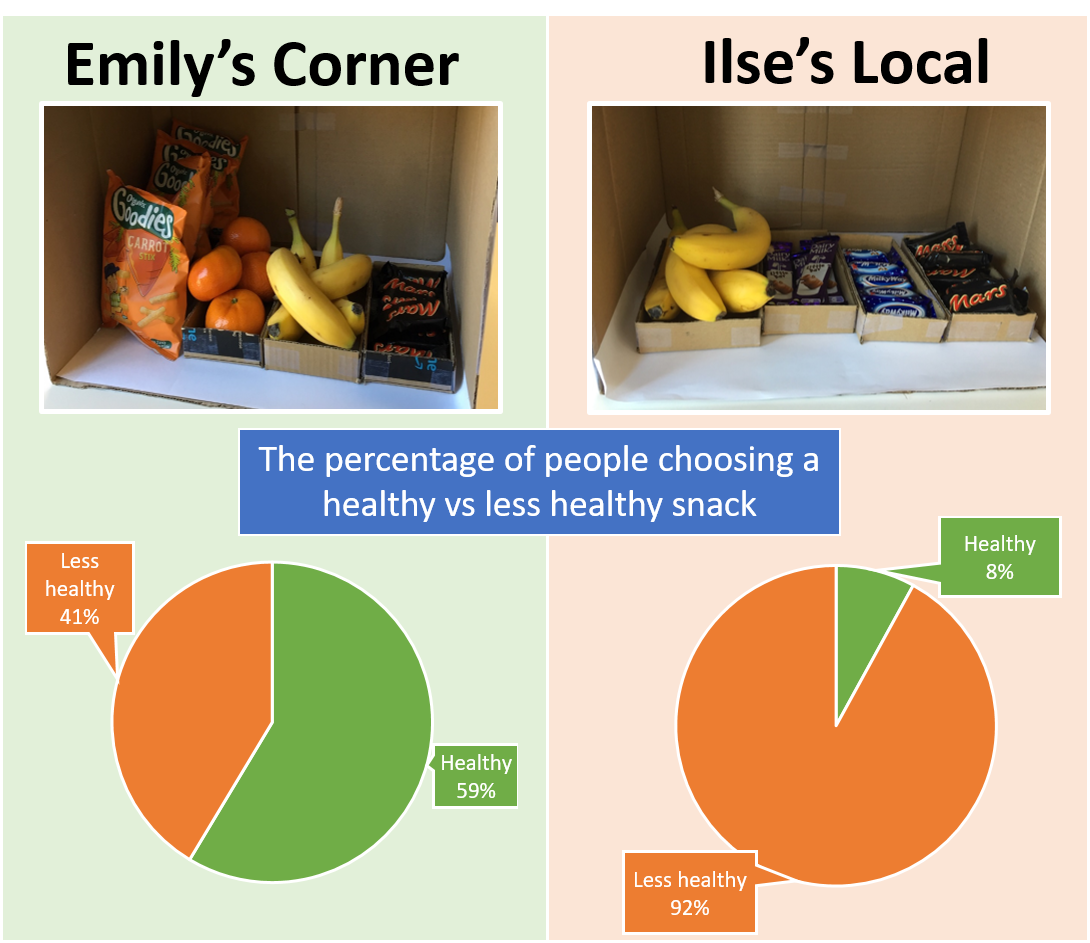
We set up two grocery shops, Emily’s Corner and Ilse’s Local in the fictional town of Choiceville. Children were asked to choose a token from a bag. If they picked a blue token, they were allowed to spend their token in Emily’s Corner to buy a snack. If they picked a pink token, then they could spend their token in Ilse’s Local.
Once they had purchased a snack, we showed them what was on offer at the other shop. The pictures of the snack options in each shop are below. Can you spot the difference between the two shops?
Emily’s Corner had three healthy options and one less healthy option. Ilse’s Local had three less healthy options and one healthy option. We collected some information on the snacks that were chosen from each store (sometimes we were too busy to record it). We found that people were more likely to choose a healthy snack from Emily’s Corner than Ilse’s Local. We used this activity to talk about the role shops play in providing healthier options to customers.
Learn more about availability here.
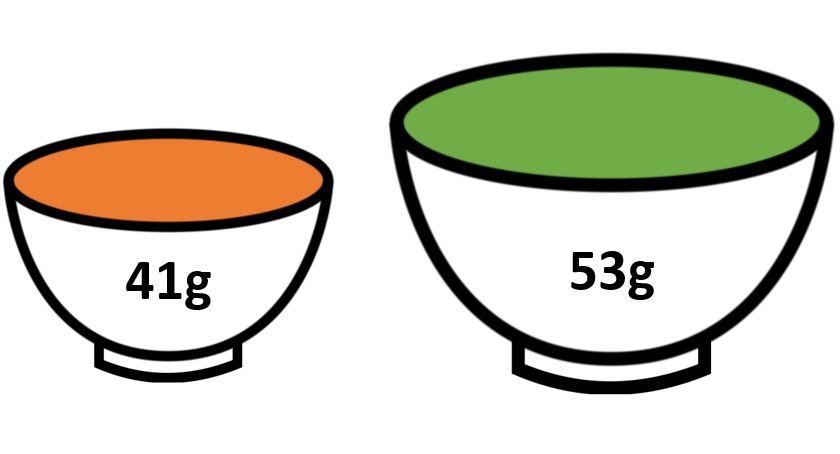
We wanted to show people how the size of their cereal bowl might influence how much cereal they pour themselves. We asked everyone to pour their usual amount of cereal into two different bowls: one big bowl and one small bowl. We then weighed the amount of cereal poured into each bowl. We recorded some of this data (again, we didn’t always manage to record it because it was very busy). On average, people poured 41g of cereal into the small bowl and 53g into the big bowl. If the cereal were Frosties, this means that people would be consuming 4g more sugar if they used a bigger bowl.
Learn more about how the size of packages, tableware and portions can influence our health here.
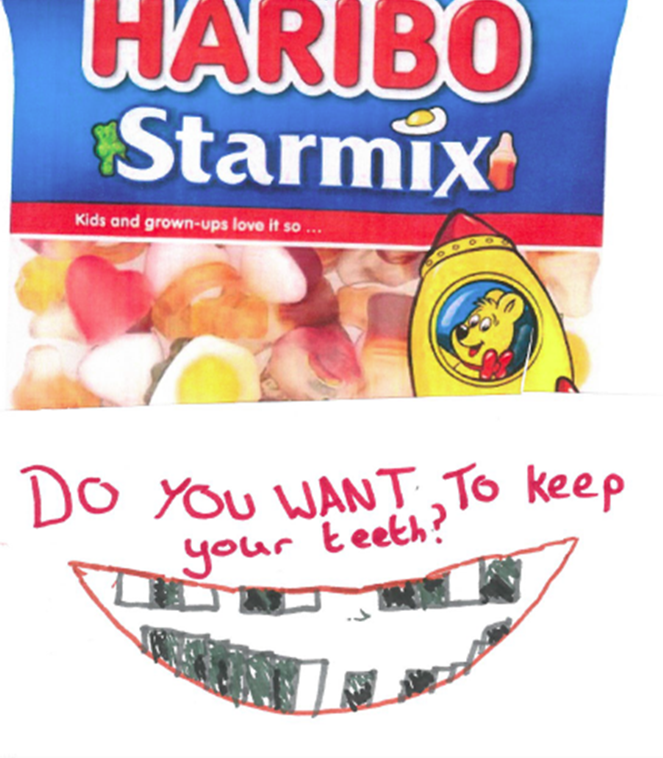
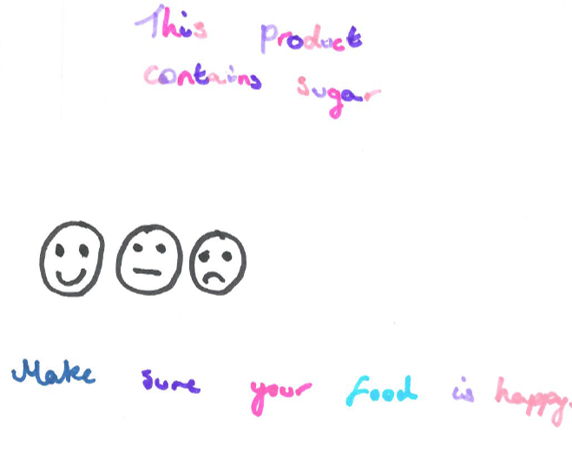
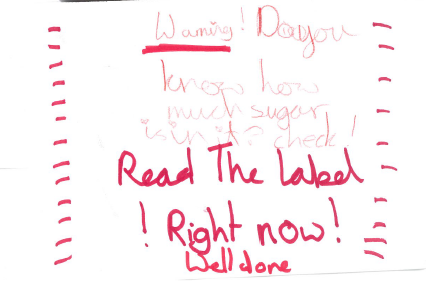
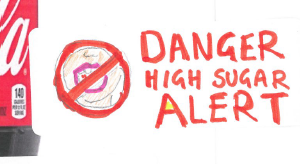
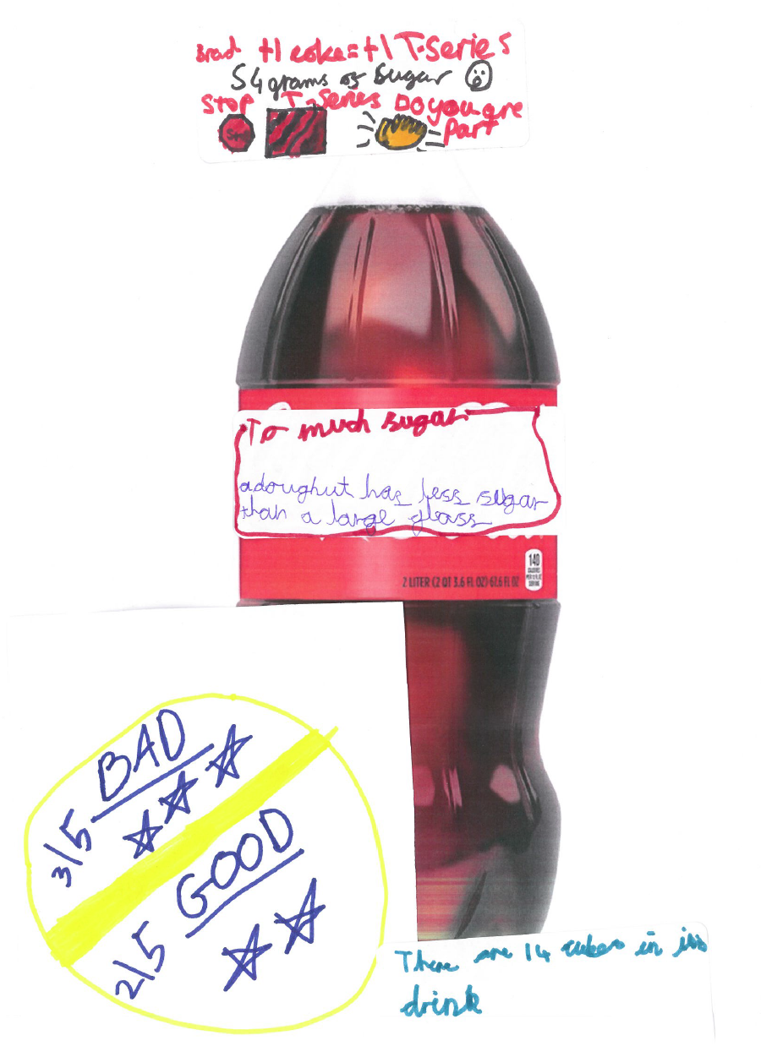
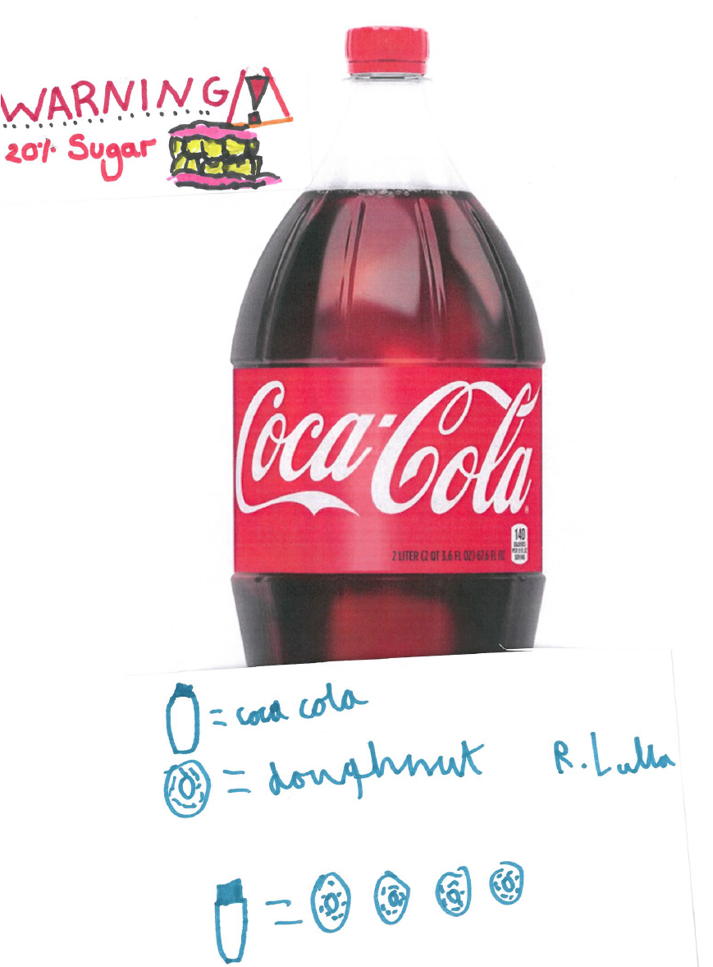
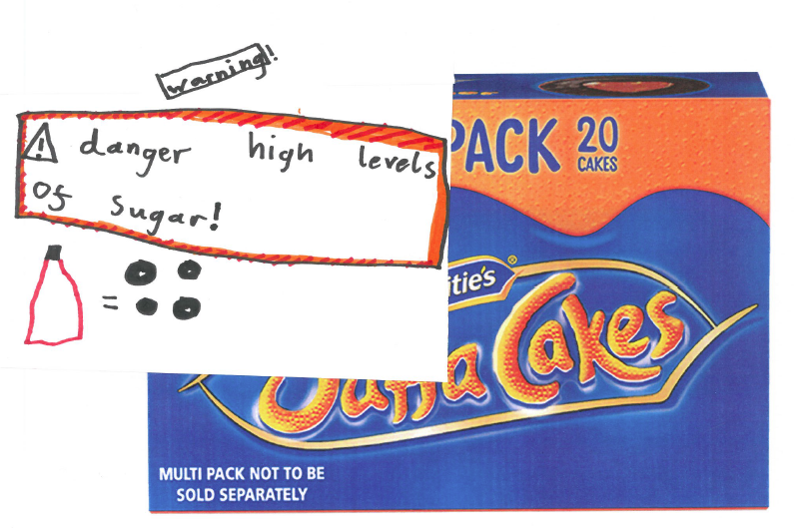
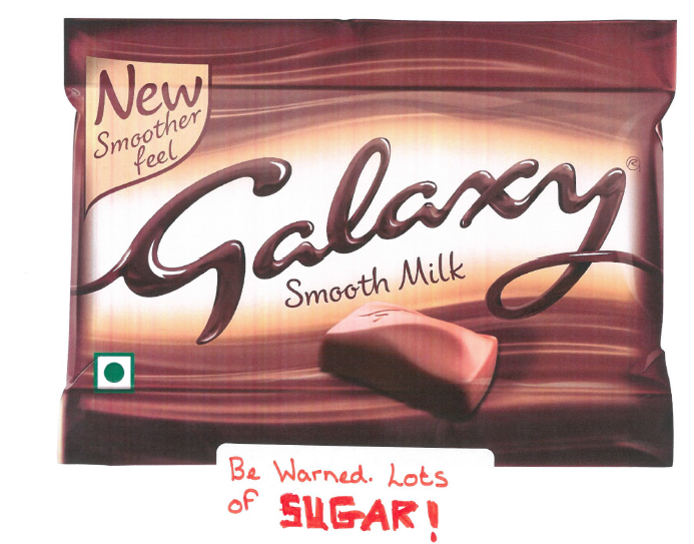
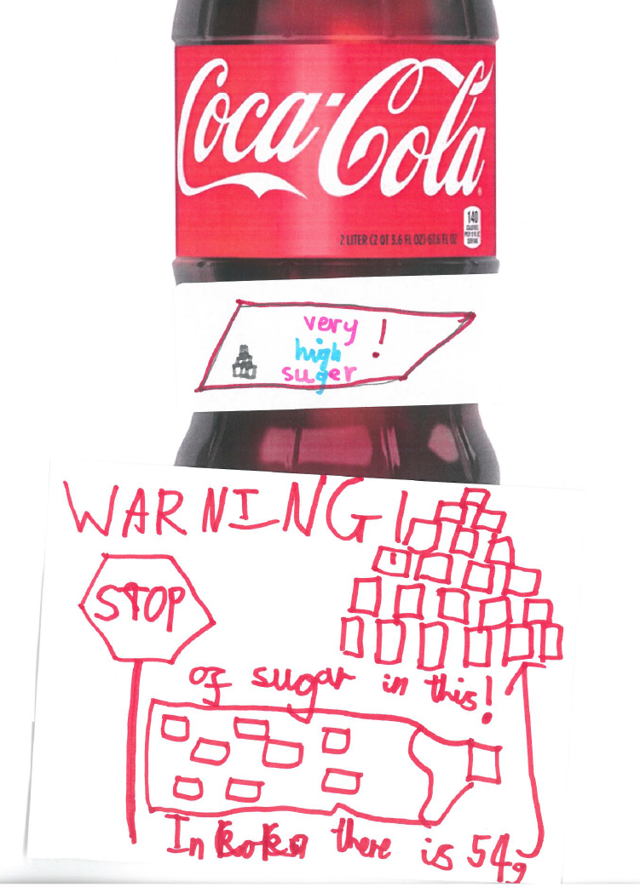
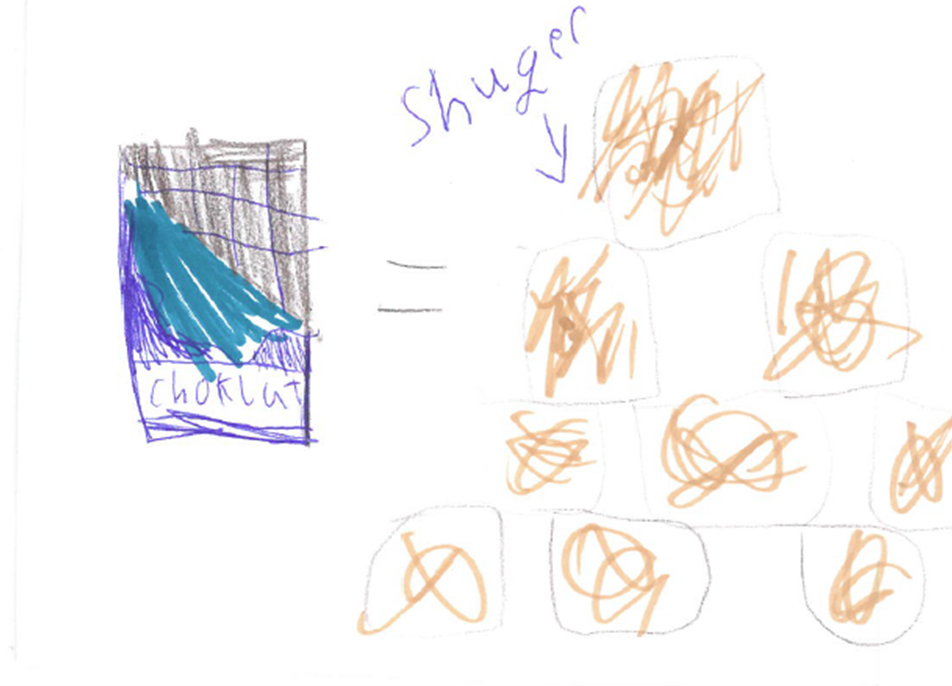
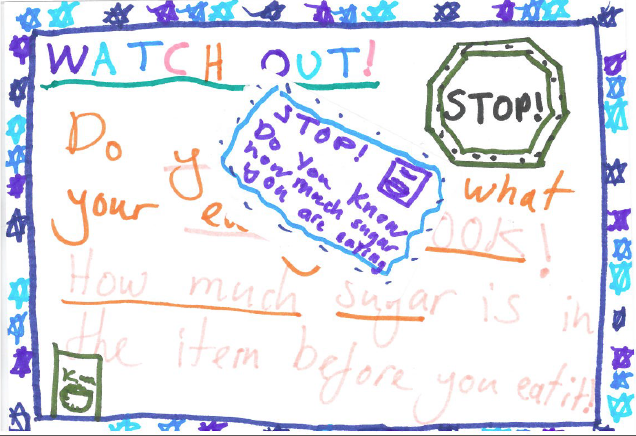
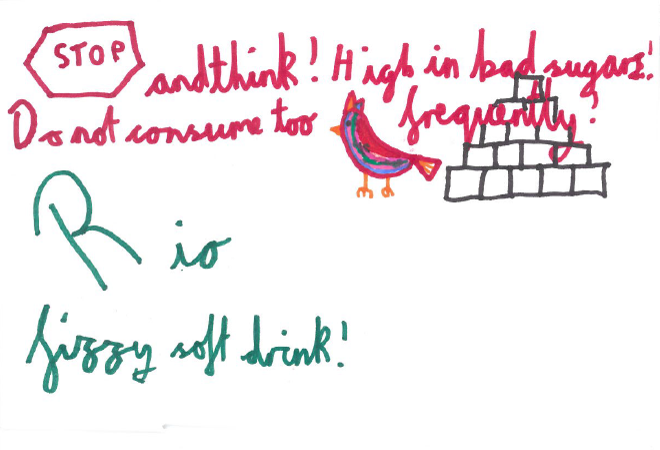
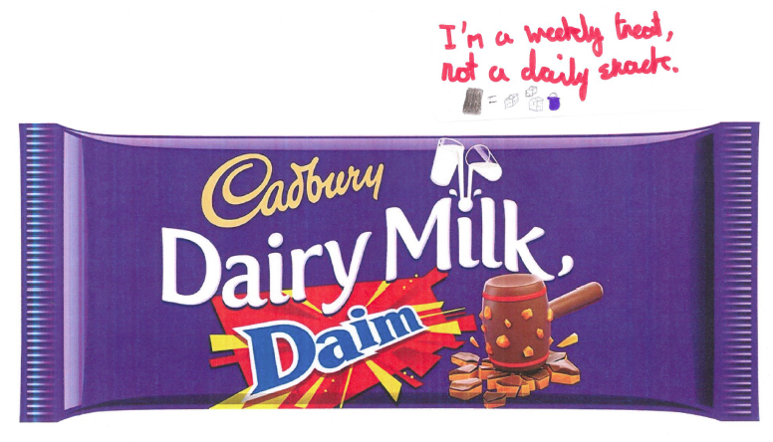
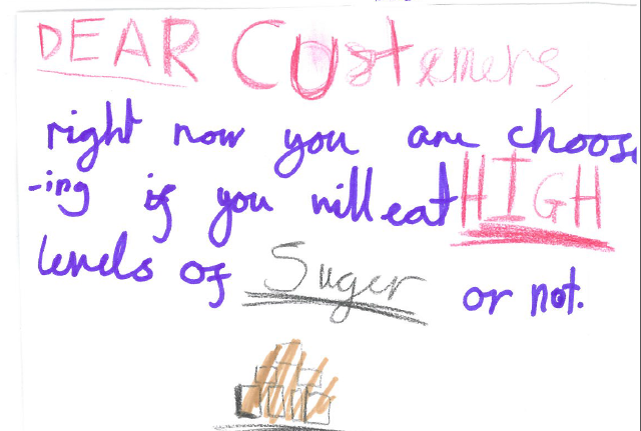
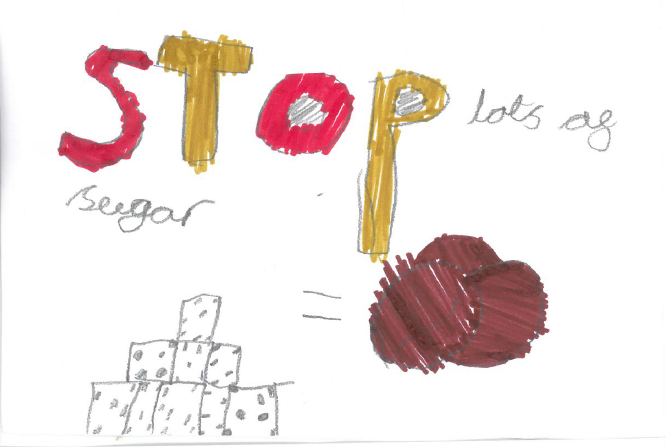
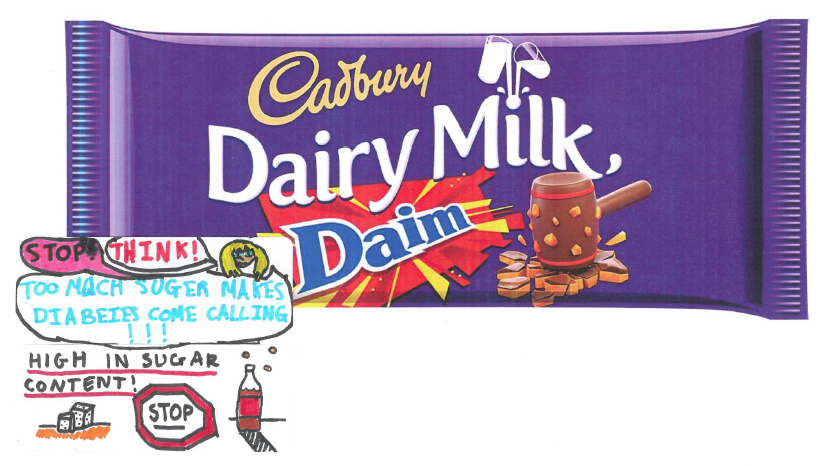
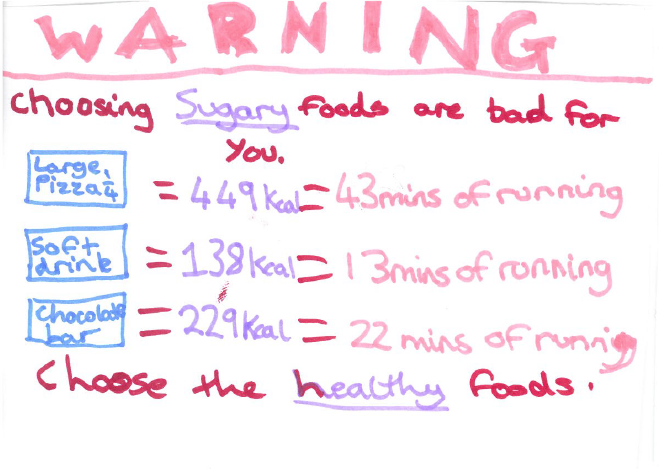
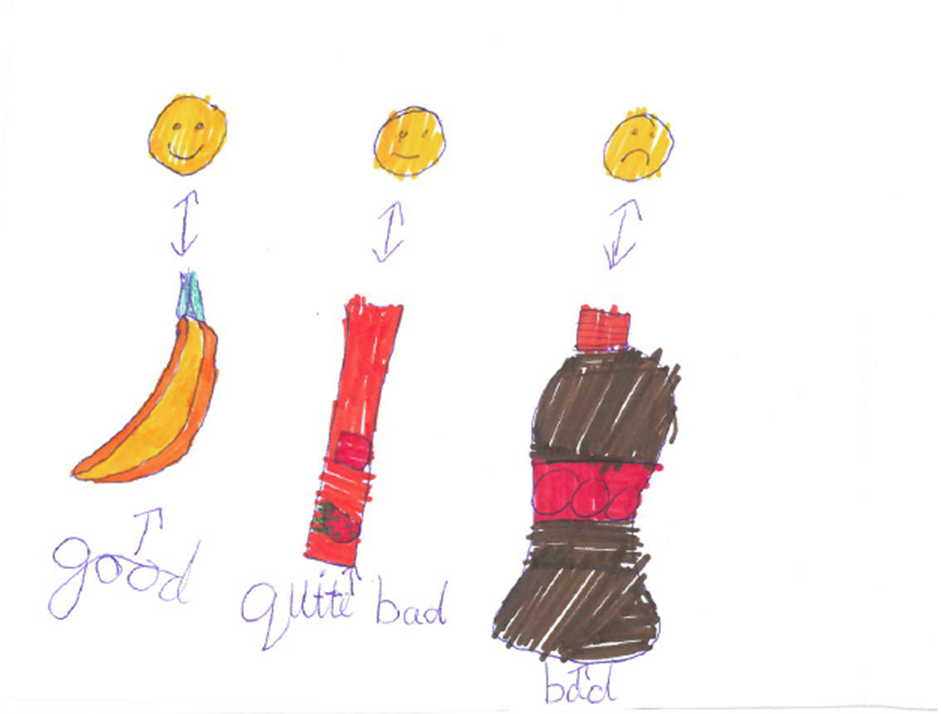
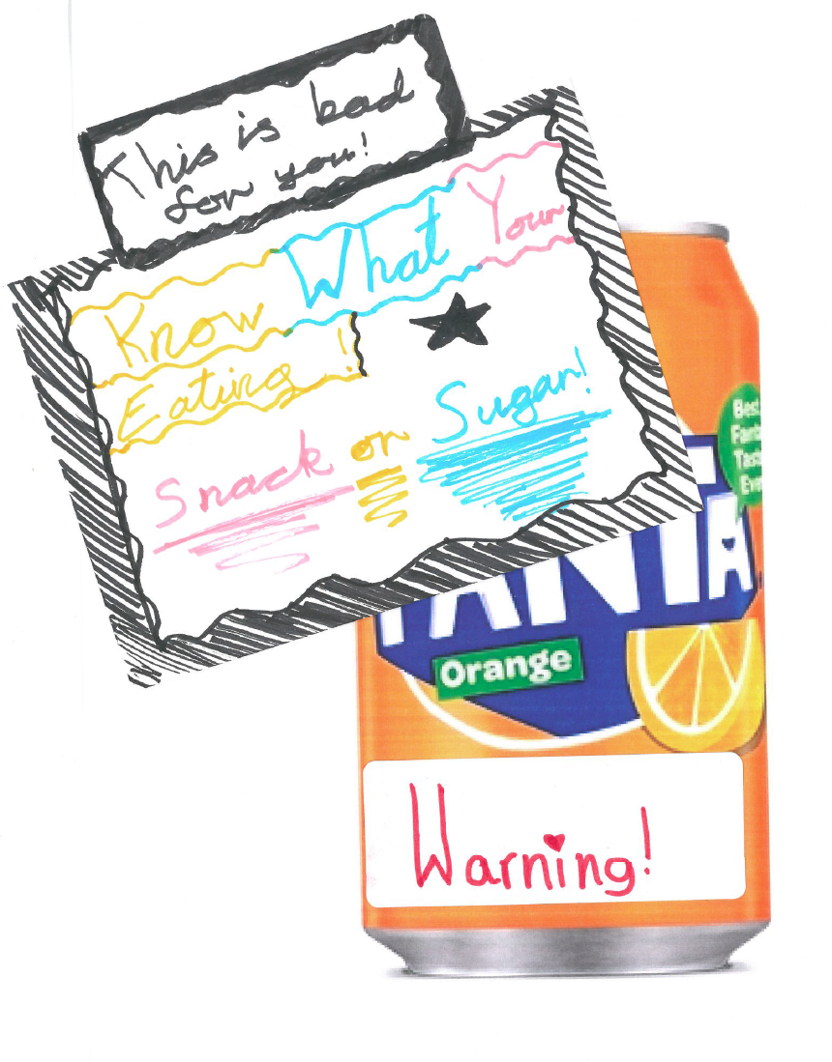
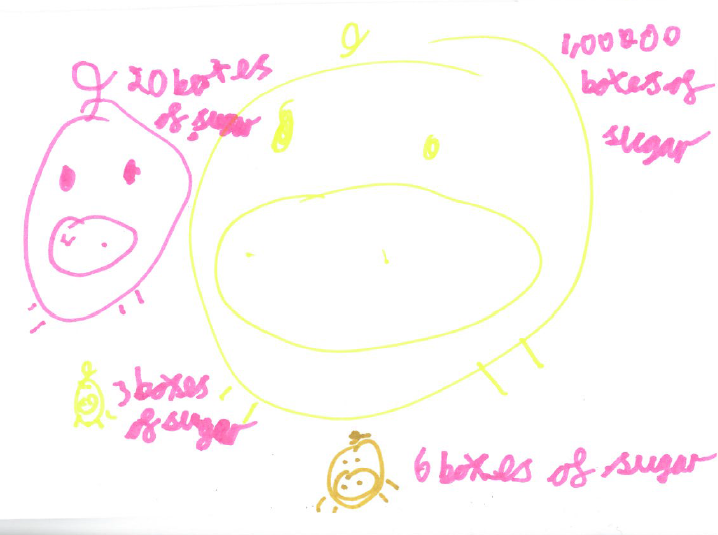
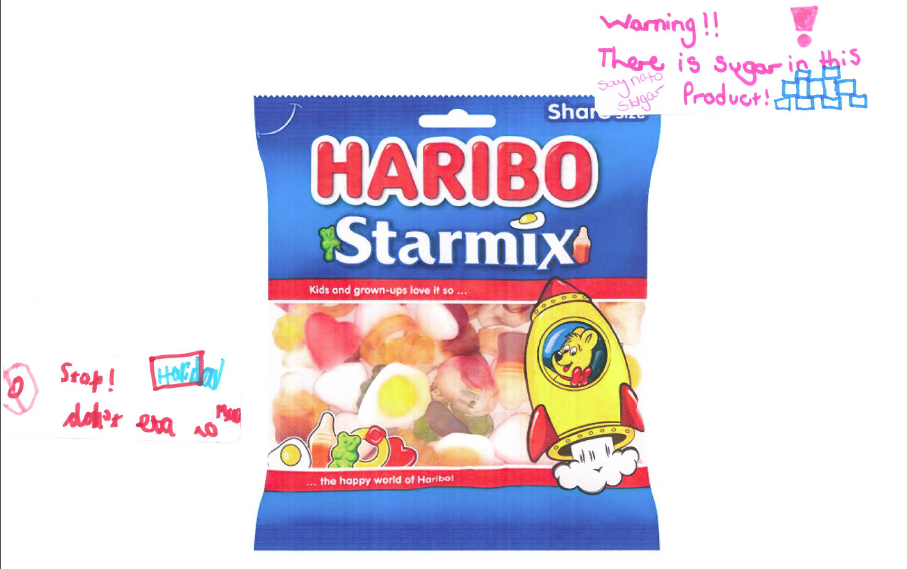
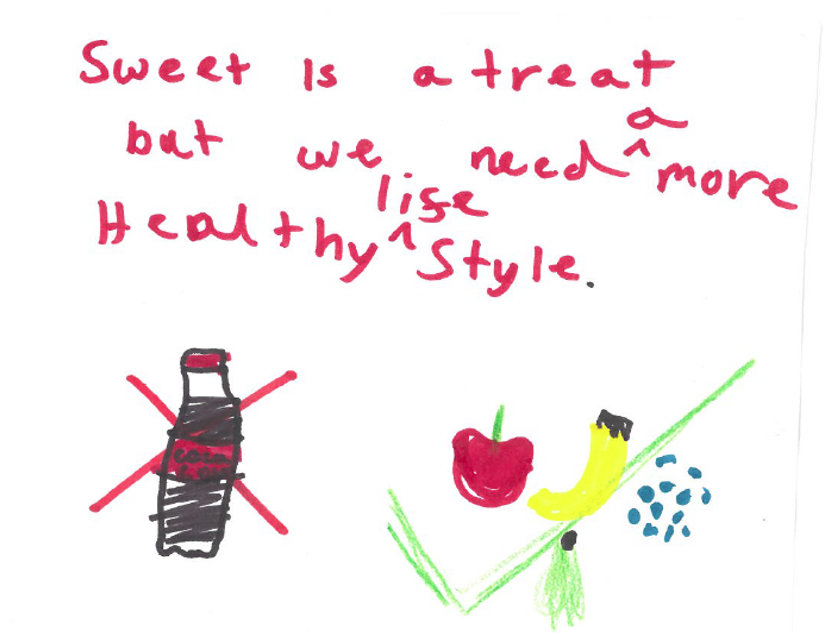
We asked children which kinds of sugary snacks they thought they ate too much of, then asked them to design a label that would help them to make healthier choices. Here are some of their wonderful and creative ideas.
Learn more about labelling here.
Thank you to everyone who took part in our activities. We hope you learned something about how our environments can shape our health.